
The Challenge
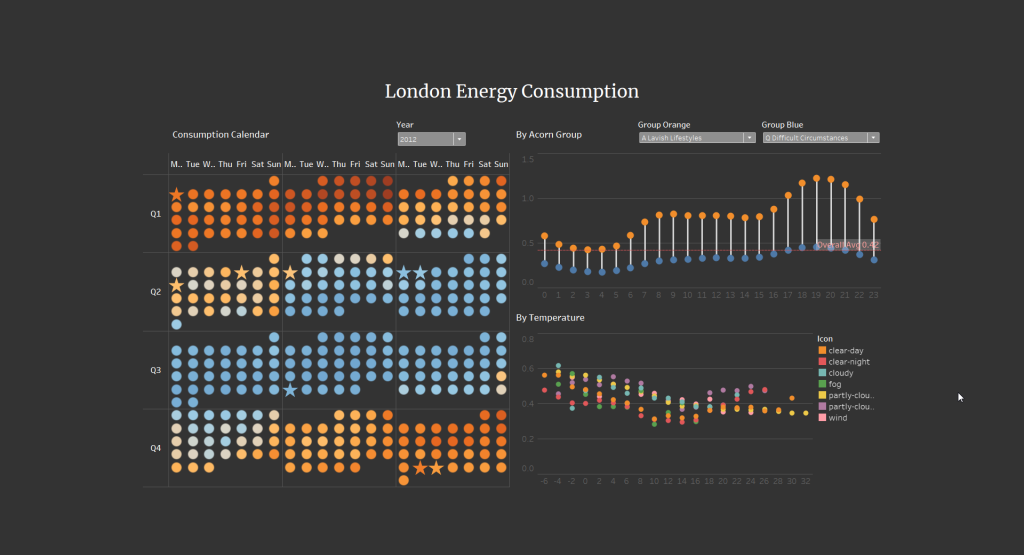
Now we are on Day 2, the challenge of today is to create a dashboard using Smart Meters in London dataset. The whole dataset includes supplementary data including Acorn, holidays and weather.
The Data
Firstly, I compared the date range among different datasets and decided to narrow down the data scope to the years 2012 and 2013.
Secondly, when I exploring the data, I found that the hourly consumption dataset is so big, the number of rows for this one table reached about 80 million rows. I spent quite a lot of time improving the workflow performance.
Last but not least, I found the holiday dataset is incorrect, so I went to google to check and fix it.
Anyway, my final Alteryx workflow is like this.

The Story
Since today’s dataset is pretty sufficient, I began with playing around with different features. I tried different time granularity, all the weather fields, Acorn groups, holidays, etc. And finally, I decided to only look at three points.
The three points are:
1. Compare 24 hours activities between different Groups
2. Look at the daily differences, including the holidays, in a calendar
3. Find the correlation between energy consumption and weather/temperature
In order to keep the consistency, and make the dashboard easy to understand, I used the hourly consumption for all charts.
The final viz can be found here.
What went well
- Rich dataset leads to tons of interesting angles, easy to derive insights
- Tried and learnt new tricks
What could be better
- Timeboxing
- Story design